Market Notes
Gold Held $4,000. The US Still Books It at $42 in 2026

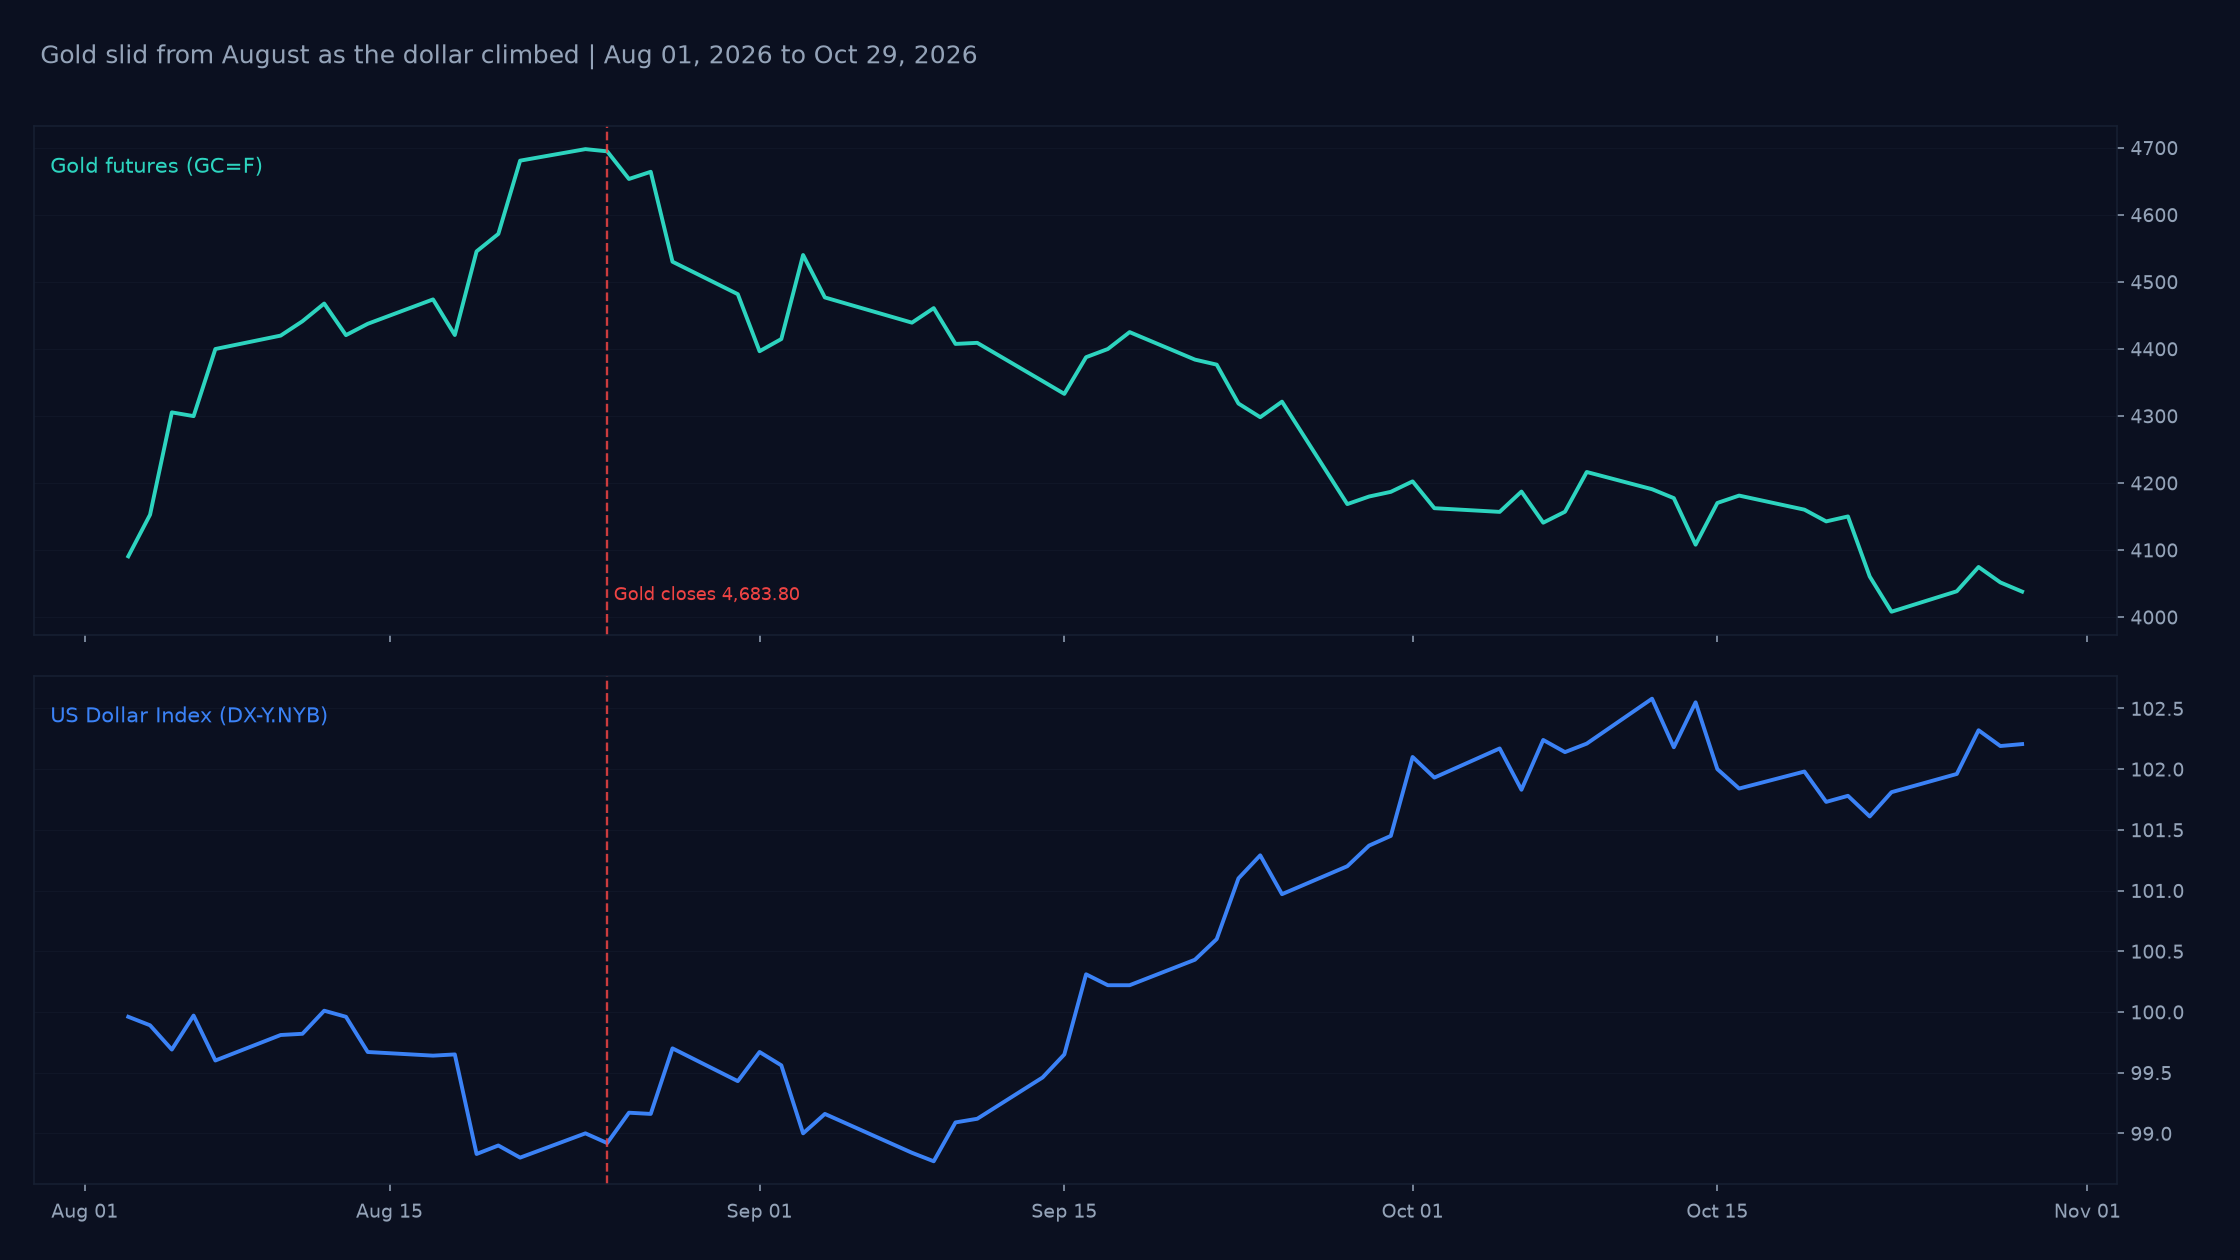
Gold futures closed at 4,033.20 on October 29, 2026, down 13.9% from 4,683.80 on August 25, and the lowest close in between was 4,007.90 on October 23. So gold isn't really back above 4,000, it just never broke it. The US government still carries every ounce it owns at $42.22 an ounce, the price written into 31 U.S.C. 5117, while that same gold is worth about $1.05 trillion at market. I think the more useful part is how the US got all of that gold and how it lost most of it, because that history is the reserve currency debate in plain numbers.
What the Data Shows
Start with how the gold got there. On April 5, 1933, Roosevelt signed Executive Order 6102, which required Americans to deliver their gold coin, gold bullion and gold certificates to the Federal Reserve by May 1, 1933. The Gold Reserve Act followed on January 30, 1934, and per the Federal Reserve's own history of the act it moved ownership of all monetary gold to the Treasury and reset the price from $20.67 to $35 an ounce. The US Mint says the first gold arrived at Fort Knox in 1937.
The peak came after the war, not before it. Fed Chairman William McChesney Martin said in a July 1957 speech that the US gold stock hit an all-time peak of $24,771 million at the end of August 1949, nearly 60% of the estimated gold reserves of the free world. At $35 an ounce that works out to about 707.7 million ounces, or roughly 22,000 metric tons. The Fed's history of the 1971 gold window closing explains the drain in one line: eventually there were more foreign-held dollars than the United States had gold.
Today's number comes from Treasury's Status Report of US Government Gold Reserve. The US held 261,498,926 fine troy ounces as of September 30, 2026, booked at $11.04 billion, the exact same figures as July 31. That's about 8,130 metric tons, or 37% of the 1949 peak, and the Fed's H.4.1 release for October 21, 2026 still shows the gold certificate account at $11,037 million with no change from the week before.
The move since August has been about the dollar. The dollar index went from 99.03 on August 25 to 102.27 on October 29, up 3.3%, and FRED had the 10-year Treasury yield at 4.99% on October 27. Over the last 5 sessions gold slipped 0.13% while the dollar index rose 0.30%, so the dollar is still winning this one.
Why It Matters for Your Portfolio
The reserve currency debate gets argued with a lot of feelings, and the gold numbers keep it simple. In 1949 the US held nearly 60% of the free world's gold, and today it holds 37% of its own peak with a dollar that hasn't been convertible into gold since 1971. If you hold gold as a hedge against the dollar, the last 2 months are worth knowing: gold gave back 13.9% while the dollar gained 3.3% and the 10-year sat near 5%. Gold can be right on the long-term story and still lose for months when the dollar is strong.
What I'm Watching
The first one is 4,000 on gold futures. The lowest close since August is 4,007.90 on October 23, so a close under 4,000 while the dollar index holds above 102 would tell me the dollar trade isn't done. The second is the boring stuff I check anyway: Treasury's next monthly gold reserve report for October 31 and the Fed's H.4.1 every Thursday. If 261,498,926 ounces or that $11,037 million certificate line ever changes, something real happened, and I want to see it there before I see it in a headline.
Related Reading: America's Gold Is Still Priced at $42 an Ounce in 2026 and The Dollar Trade Nobody's Talking About in 2026
Howard is a full-time trader based in New Jersey with 13 years of experience across Forex, crypto, equities, and futures. He started Position Note to document his trades and analysis in public. All positions are disclosed. Nothing here is personalized investment advice.